
Jan Wijffels
Open Data in Belgium - release of BelgiumStatistics R package
R
On 22/10/2015, the Belgium government launched its Open Data initiative by releasing a number of datasets related to population statistics, fiscal information, 'kadaster', the 2011 census and some tools. Because BNOSAC works a lot with these kind of data and because we like to promote open data, an R package called BelgiumStatistics was made available for R users at https://github.com/jwijffels/BelgiumStatistics
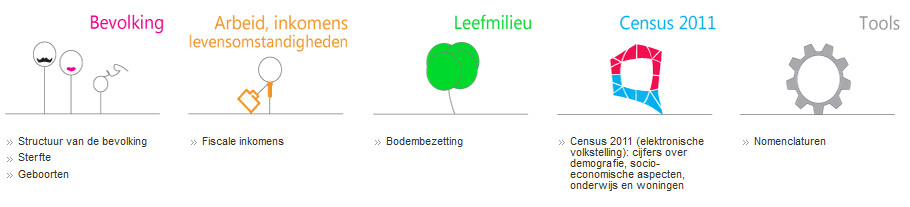
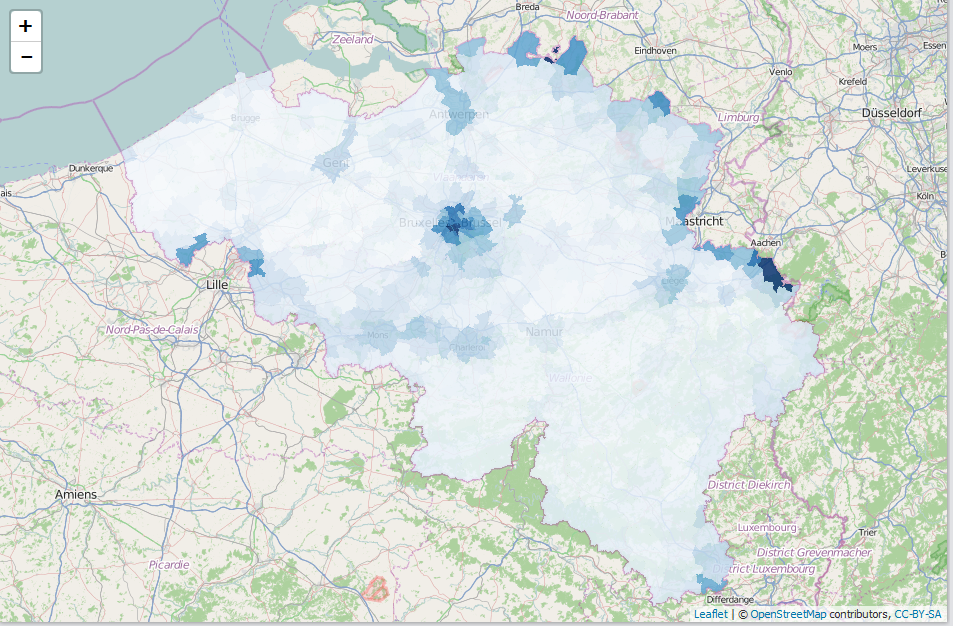
The package contains all the datasets released by Statistics Belgium (Bevolking, Werk, Leefmilieu, Census 2011) under the 'Licentie open data'. Readily available to R users. Thanks to the open data, analysing and visualising Belgium data has now become a lot smoother as the example below shows.
require(BelgiumStatistics)

require(data.table)

require(BelgiumMaps)

require(leaflet)

data(TF_SOC_POP_STRUCT_2015) ## Part of BelgiumStatistics

data(mapbelgium.fusiegemeenten.wgs) ## Part of BelgiumMaps (not released yet)


x <- as.data.table(TF_SOC_POP_STRUCT_2015)

x <- x[, list(MS_POPULATION = sum(MS_POPULATION),

              Foreigners = sum(MS_POPULATION[TX_NATLTY_NL == "Vreemdelingen"]) / sum(MS_POPULATION),

              Age = 100 * sum(MS_POPULATION * CD_AGE) / sum(MS_POPULATION),

              Females = 100 * sum(MS_POPULATION[CD_SEX == "F"]) / sum(MS_POPULATION)),

       by = list(CD_MUNTY_REFNIS, TX_MUNTY_DESCR_NL)]

x <- setDF(x)


mymap <- merge(mapbelgium.fusiegemeenten.wgs,

               x, by.x = "ORDER08", by.y = "CD_MUNTY_REFNIS", all.x=TRUE, all.y=FALSE)

mymap <- subset(mymap, !is.na(Foreigners))

pal <- colorNumeric(palette = "Blues", domain = mymap$Foreigners)

leaflet(mymap) %>%

  addTiles() %>%

  addPolygons(stroke = FALSE, smoothFactor = 0.2, fillOpacity = 0.85, color = ~pal(Foreigners))
If you are interested in geographical analysis or visualisations, Get in touch.